Annual Meeting of Stockholders

December 18, 2008

JOHN MADDEN

TONY STEWART

MARTHA STEWART

HOWARD STERN

BOB DYLAN

FRANK SINATRA

BRUCE SPRINGSTEEN

JAMIE FOXX

CAL RIPKEN

OPRAH WINFREY


Agenda

I.   Operations

II.  Liquidity

III. Stock Price

IV. Questions and Answers

1


I. Operations

Operational Overview

2


Quote of the Week

“The historic slowdown in the economy
and its effect on our business over the
past 90 days have been the most
challenging consumer environment our
company has ever faced.”

                                    - Best Buy CEO Brad Anderson

3


SIRIUS XM: navigating a challenging business environment

Deep recession now underway

Financial markets remain disrupted

Unemployment at 6.7% - highest since 1993 - and
expected to increase as layoffs accelerate

Consumer confidence at all time lows

Weakest car sales in 26 years - November down
37%

Retail / Consumer Electronics market struggles

4


2008

2008

5


Scale creates greater operating leverage

Source: Company filings

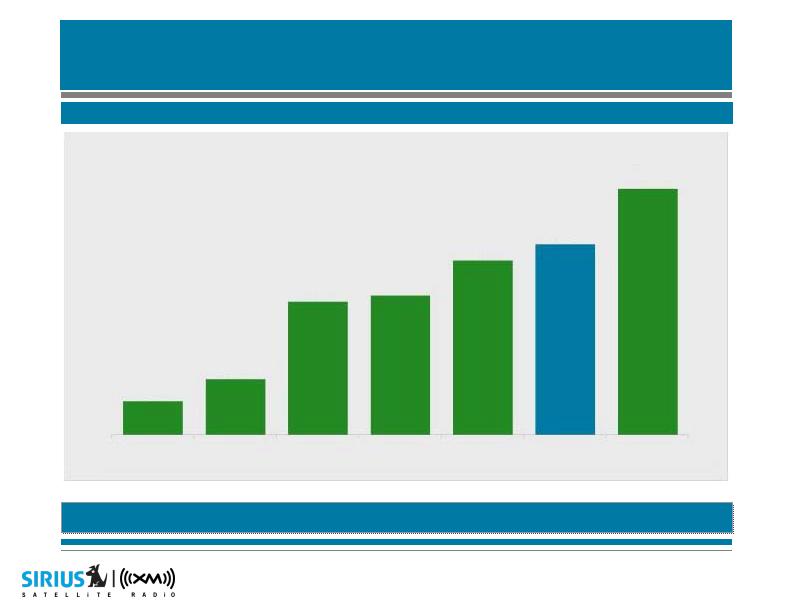
Ranks among largest U.S. subscription media
businesses

Total subscribers as of 3Q08 (millions)

6

3.3

5.5

13.2

13.8

17.3

18.9

24.4

Cablevision

Charter

Time Warner
Cable

Dish Network

DirecTV

SIRIUS XM

Comcast


Source: Company filings

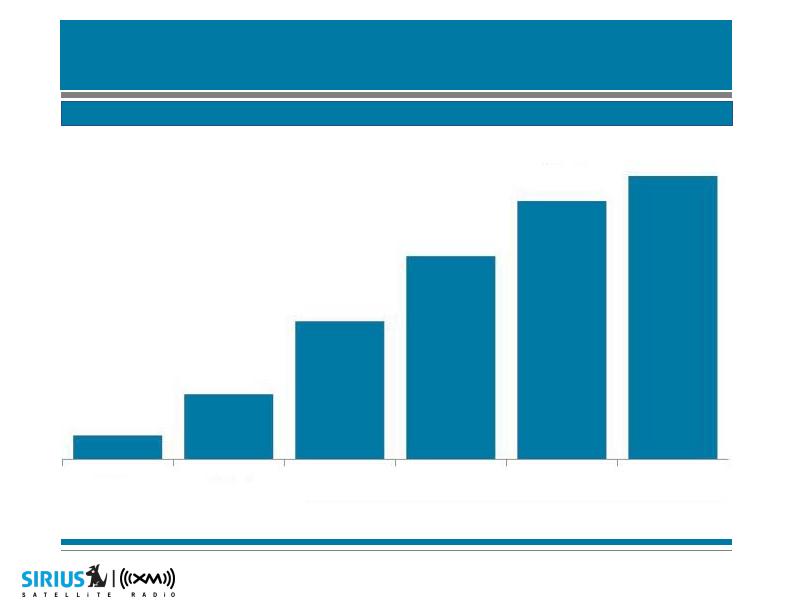
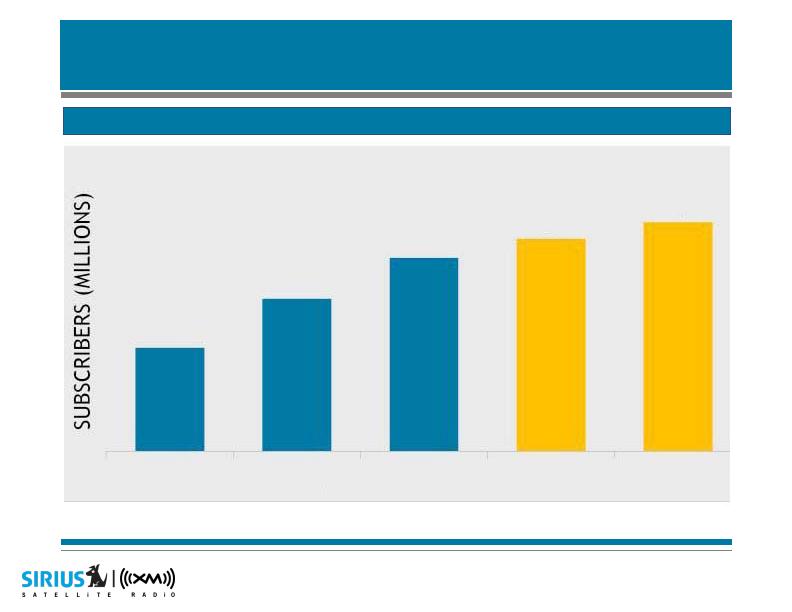
Ending SIRIUS XM subs (millions)

Strong subscriber growth, 2003 - 2008E

7

1.6

4.4

9.3

13.7

17.4

19.1

2003

2004

2005

2006

2007

2008E


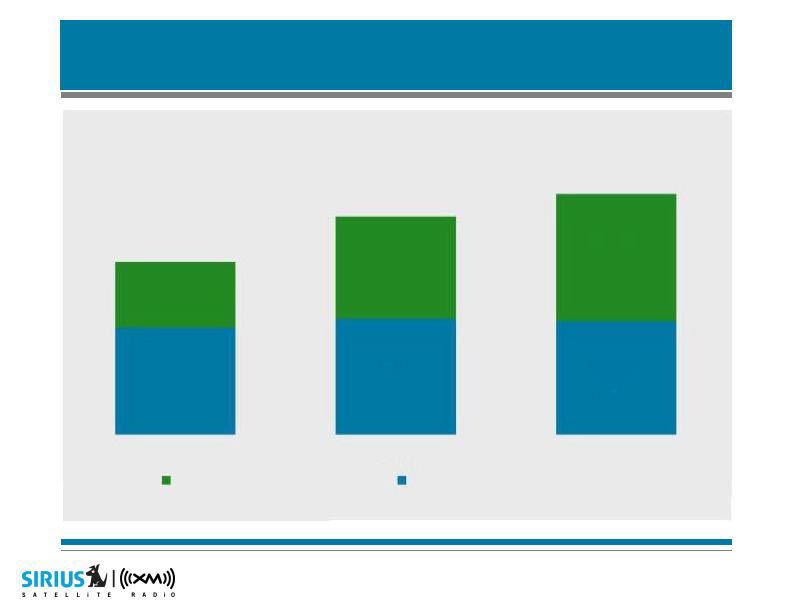
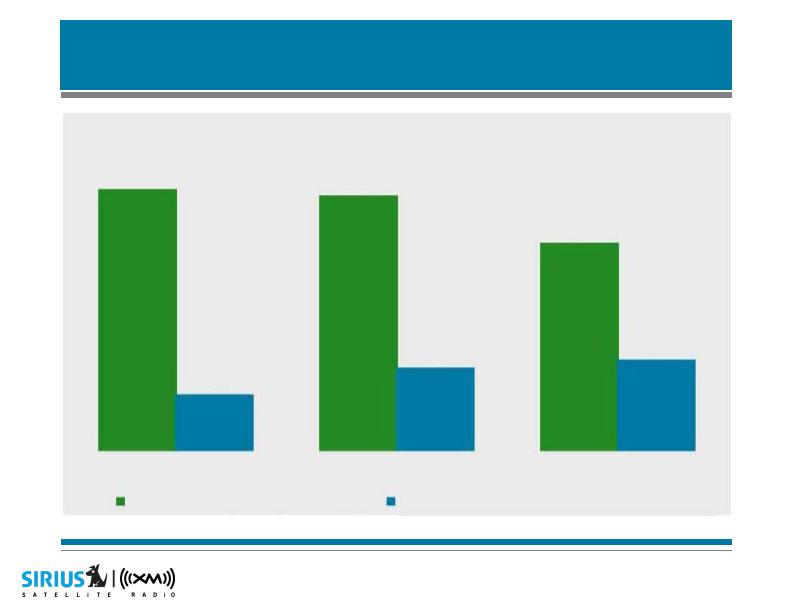
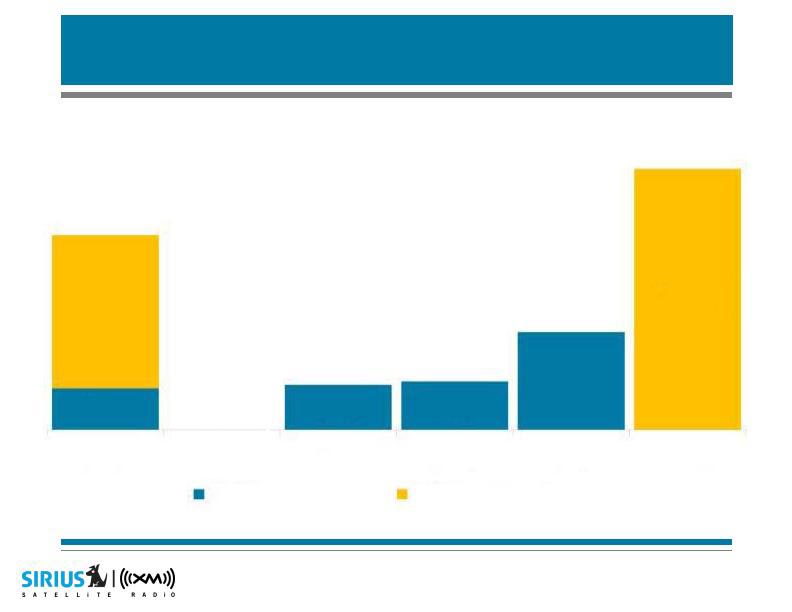
Ending subscribers by channel (millions)

13.7

17.3

19.1

Source: Company filings

8

2006

2007

2008E

OEM Ending Subs (millions)

Aftermarket Ending Subs (millions)

5.2

8.5

9.2

9.0

8.1

10.1


OEM industry sales and gross add trends

Source: Company filings and estimates

9

16.6

3.6

16.2

5.3

13.2

5.8

2006

2007

2008E

OEM Industry Sales (millions)

SIRIUS XM OEM Gross Adds (millions)


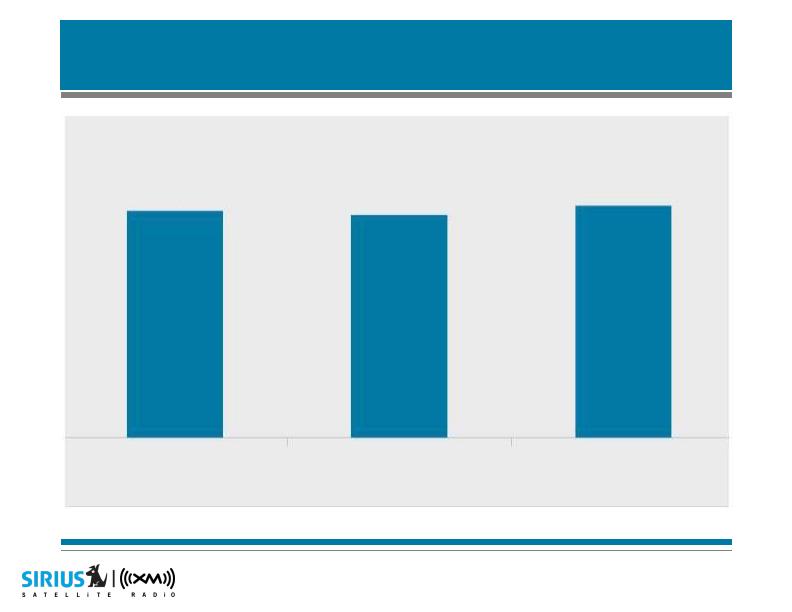
Stable self-pay churn rates

Source: Company filings and estimates

10

1.70%

1.77%

1.73%

2006

2007

2008E


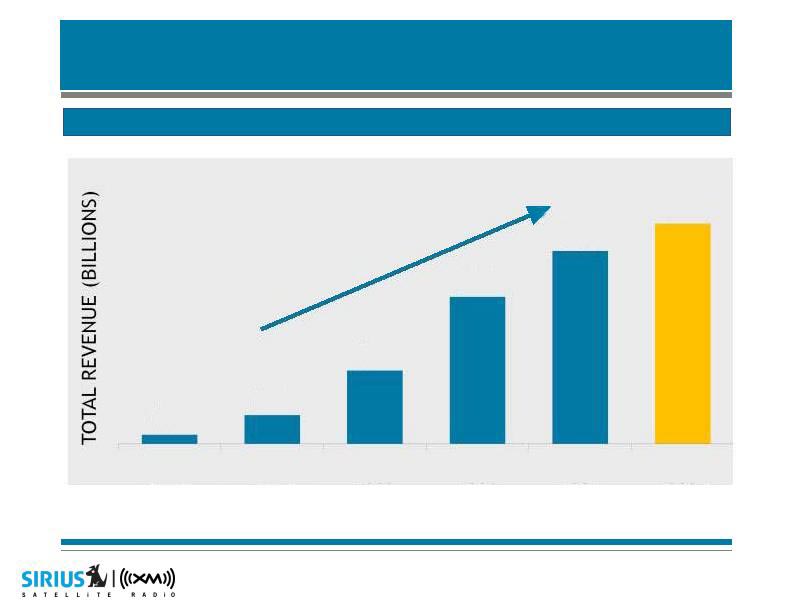
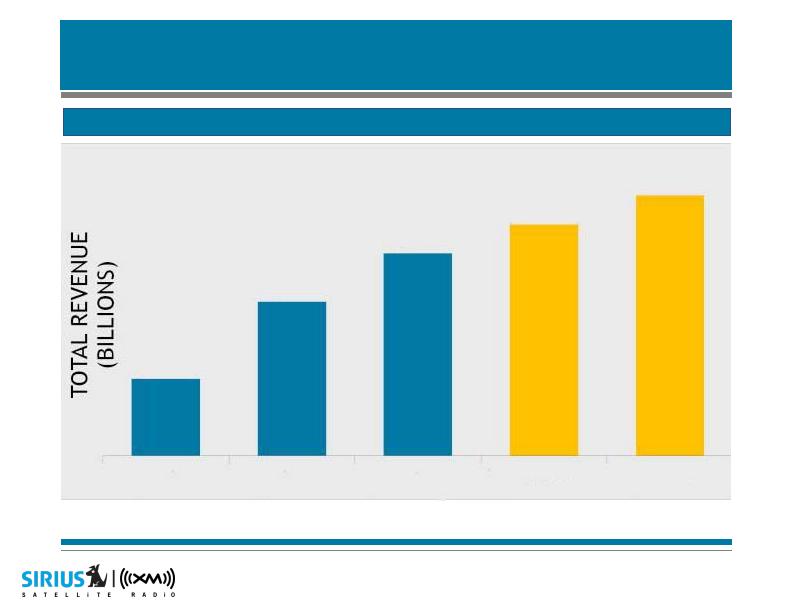
Substantial revenue growth

Revenue Guidance:  Approximately $2.4 b in 2008

Source: Company filings and estimates

11

$0.3

$0.8

$1.6

$2.1

$2.4

$0.1

2004

2005

2006

2007

2008E

2003


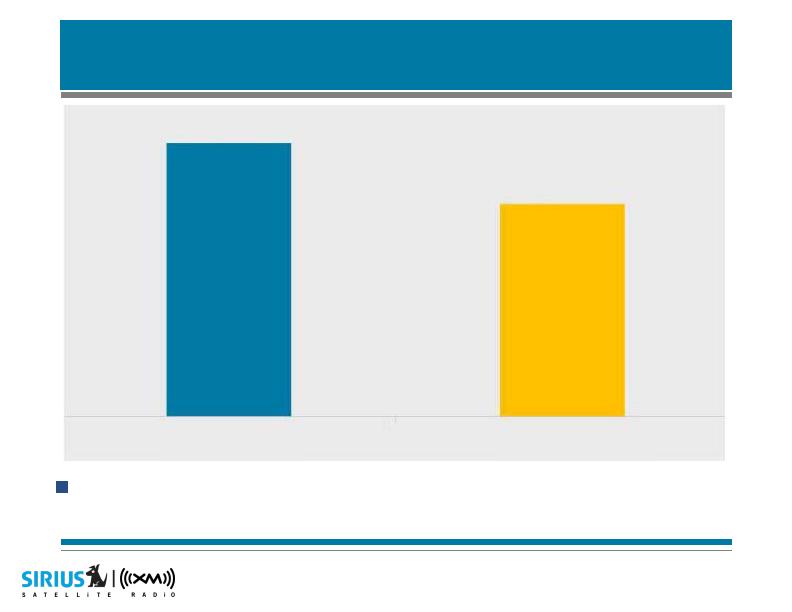
Lower headcount driven by merger
efficiencies

Total company headcount will be 22% lower by year-end 2008

Source: Company estimates.

12

2,058

1,600

Ending 2008

Pre-Merger


Growth statistics

In millions except per unit metrics

Actual
2006

Actual
2007

Estimate
2008

Ending Subscribers Growth Rate

48%

27%

10%

Revenue Growth Rate

96%

31%

17%

Total Cash Operating Expense Growth Rate

44%

16%

0%

Source: Company filings and estimates

13


Improved 2008 adjusted EBITDA guidance

Source: Company filings and estimates

14

New adjusted EBITDA guidance of ($200) mm in 2008,
revised from ($300) mm

3Q08 adjusted EBITDA ex. merger costs close to
break-even before substantial synergy benefits

Guidance implies 4Q08 adjusted EBITDA of ($32) mm versus pro forma 4Q07 of ($224) mm, an 86% improvement


November channel rationalization - reduced
costs and improved user experience

Line-ups largely combined - best audio experience being made
available to both SIRIUS and XM listeners at no extra cost, and with no
new hardware required

Total cost savings of over $35 million annually (<10k consumer
cancellations)

Music

Before - total production of 130 music channels;

After - total of 67 channels

SIRIUS and XM both feature 69 commercial-free music channels, 63
of which are shared

Talk & Sports

Before - total production of 164 talk/sports channels;

After - total of 147 channels

SIRIUS now has 75 talk/sports channels; XM now has 134 (part time
channels are included in XM totals); 38 shared channels

Note: Figures exclude Clear Channel produced channels and Canadian channels.

15


2009

2009

16


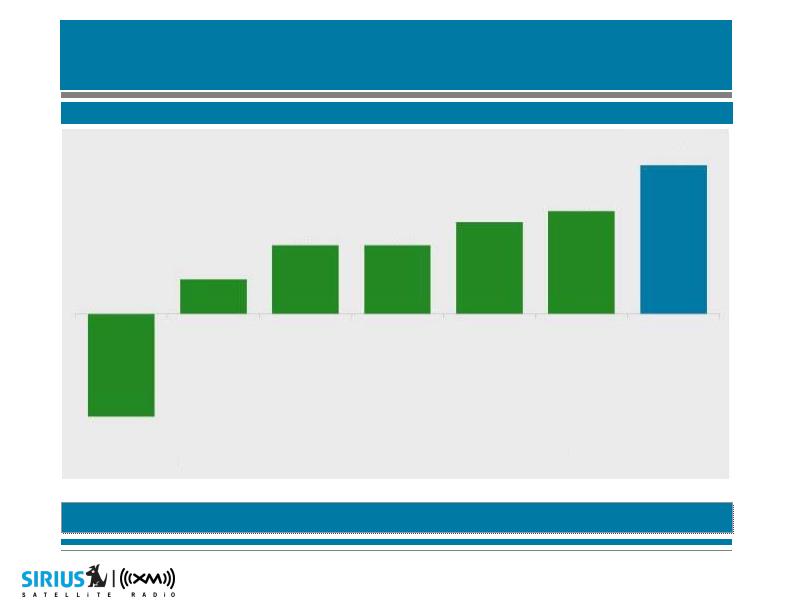
Faster growth than other subscription media

Source: Company, Merrill Lynch or Consensus Estimates

Among the fastest growing U.S. media
businesses

2009E Revenue Growth

17

3%

6%

6%

8%

9%

13%

-9%
Radio
Industry


Dish
Network


Comcast

Time
Warner
Cable


Cablevision


DirecTV


SIRIUS XM


Combined OEM penetration as a percentage of U.S. auto sales

Source: Global Insight estimate as of June 2008 and company filings.  Actual 2008 and 2009 numbers may differ materially.

Penetration gains at every major automaker

Penetration gains expected to continue to drive net subscriber additions

18

15%

22%

33%

45%

50%+

2005

2006

2007

2008E

2009E


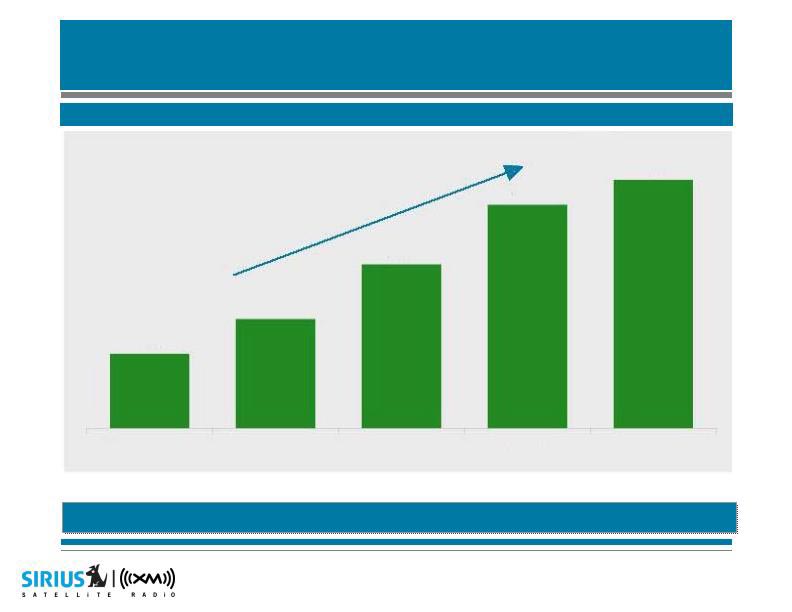
Continued subscriber growth despite weak
OEM sales…

Subscriber Guidance:  Approximately 19.1 mm in 2008 and 20.6 mm in 2009

Source: Company filings and estimates.

19

9.3

13.7

17.4

19.1

20.6

2005

2006

2007

2008E

2009E


…Drives revenue growth in 2008 and 2009

Revenue Guidance:  Approximately $2.4 b in 2008 and $2.7 b in 2009

Source: Company filings and estimates.

20

$0.8

$1.6

$2.1

$2.4

$2.7

2005

2006

2007

2008E

2009E


21

Synergies: approx. $425 mm in 2009 and
growing

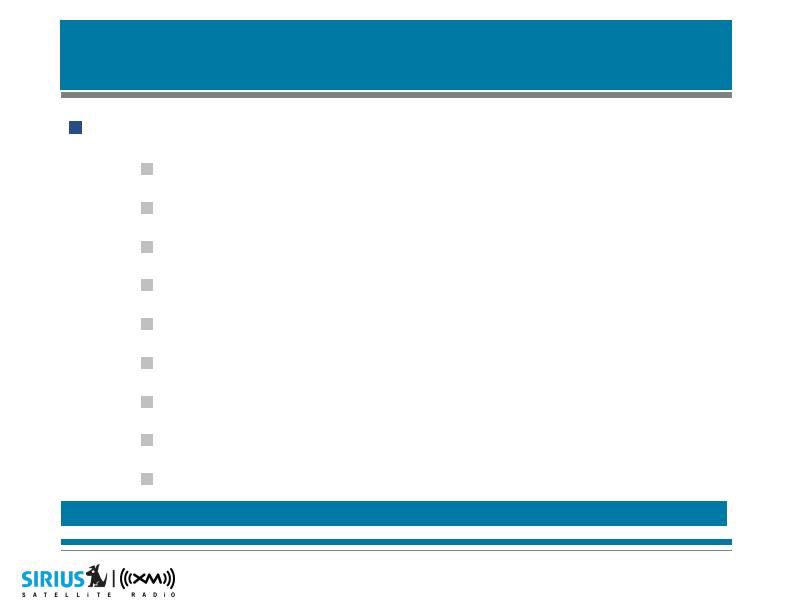
Expected approximate 2009 synergies:

Satellite & Transmission:  $20 mm

Programming:  $60 mm

Customer Service & Billing:  $20 mm

SAC:  $50 mm

Sales & Marketing:  $150 mm

General & Administrative:  $50 mm

Research & Development:  $25 mm

Revenue Synergies:  $40 mm

Capital Expenditures:  $10 mm

Synergies expected to grow in 2010 and beyond


Price plans to drive subscriber revenue
growth

Best of SIRIUS/XM upgrade launched October 2

$4 premium upgrade to be marketed to over 18 million existing
subscribers

Best of SIRIUS on XM includes:

Howard 100, Howard 101, SIRIUS NFL Radio*, SIRIUS
NASCAR Radio*, Martha Stewart Living Radio and
Playboy Radio

Best of XM on SIRIUS includes:

MLB HomePlate, Oprah& Friends, NBA*, The Virus, NHL
Home Ice*, The PGA Tour Network, College Sports,
Public Radio featuring Bob Edwards and The IndyCar
Series

A La Carte radios in stores; new packages launched on October 2

Lower price options to retain more price sensitive subscribers

* Sports offerings on “Best of Both” also includes channels for play-by-play of NHL, NBA, NFL games and NASCAR races.

22


Substantial EBITDA improvement in 2009

23

Adjusted EBITDA turns positive in 2009

Approximately ($200) mm in 2008

Approximately $300 mm in 2009

Driven by revenue growth and cost cuts / synergies, offset
by royalty and revenue share increases

Source: Company filings and estimates.


Current long range guidance

Subs (millions), $s in
billions

Guidance
2009

Guidance
2010

Guidance

2011

Guidance

2012

Guidance
2013

Ending Subscribers

20.6

22.1

24.0

26.2

28.4

Total Revenue

$2.7

$3.0

$3.4

$3.8

$4.1

Adjusted EBITDA

$0.3

$0.6

$0.9

$1.3

$1.5

Free Cash Flow

$0.0

$0.4

$0.6

$1.0

$1.4

Source: Company filings and estimates.  See slide at back for GAAP reconciliations.

24


II. Liquidity

Liquidity Overview

25


Debt Maturities: 2009 - 2013

$995

Source: Company filings

26

$783

$212

$0

$230

$248

$500

$1,334

2009

2010

2011

2012

2013

2014

SIRIUS ($ millions)

XM ($ millions)


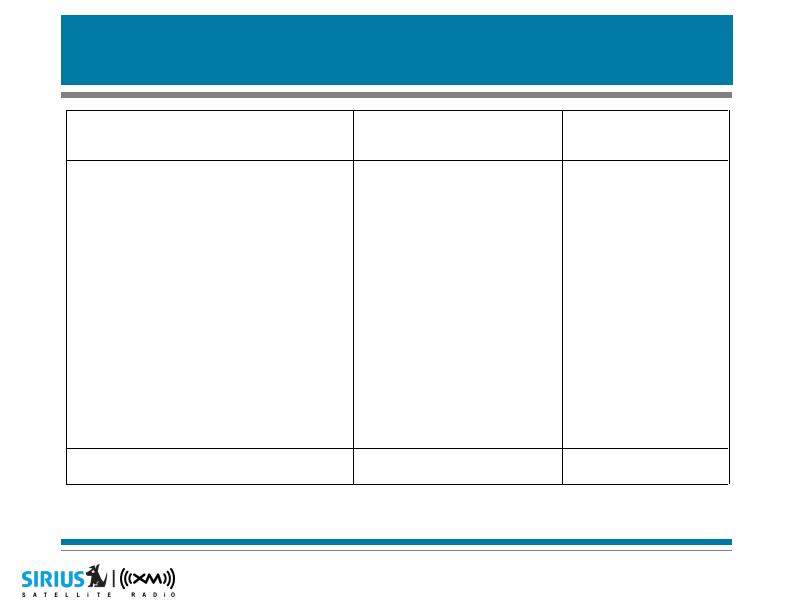
2009 Debt Maturities

Debt Instrument

Due Date

Amount

(millions)

SIRIUS

  2.5% Convertible Notes

Feb-09

$209

  8.75% Convertible Notes

Sep-09

$2

XM

  Revolving Credit Facility

May-09

$250

  UBS Term Loan

May-09

$100

  10% Convertible Notes

Dec-09

$400

  10% Secured Conv. Notes

Dec-09

   $33

Total debt maturing in 2009

$995

Source: Company filings

27


High yield debt market overview

Sep. 15 bankruptcy of Lehman Brothers brought markets
to a virtual standstill - no new CCC paper since then

Rates are at all time high spreads to Treasuries

Source: Morgan Stanley

28

Feb-07

Jul-08

Dec-08

Leveraged

Loan Index (Yield)

7.76%

9.40%

24.29%

CCC Rated

Pricing

Yield

Current

High Yield Issuances

Date

Amount (mm)

at Issue

Yield

XM Satellite Radio

7/24/2008

$779

16%

52%

Guitar Center

8/6/2008

$777

13%

NA

Clear Channel

9/11/2008

$228

18%

48%


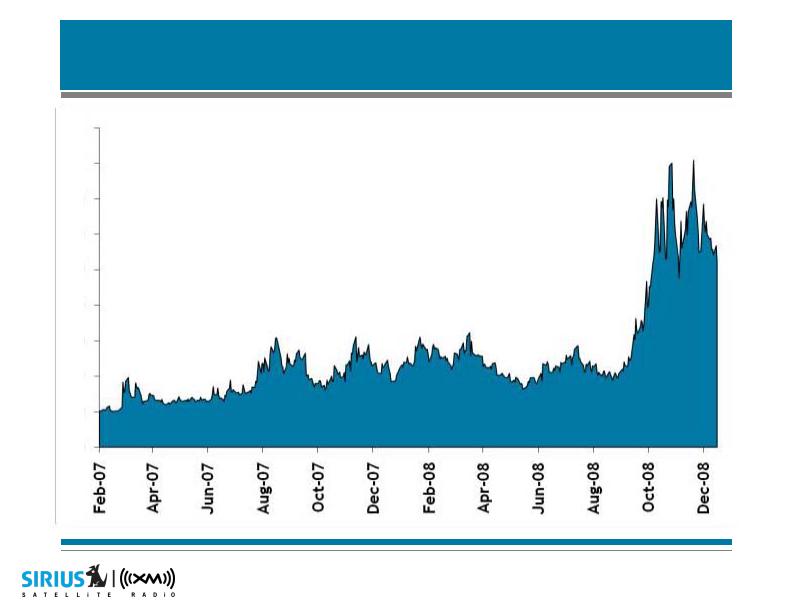
CBOE Volatility Index: up five fold from
February 2007 - present

2/16/07:  $10.02

12/16/08:  $52.37

29

90

80

70

60

50

40

30

20

10

0


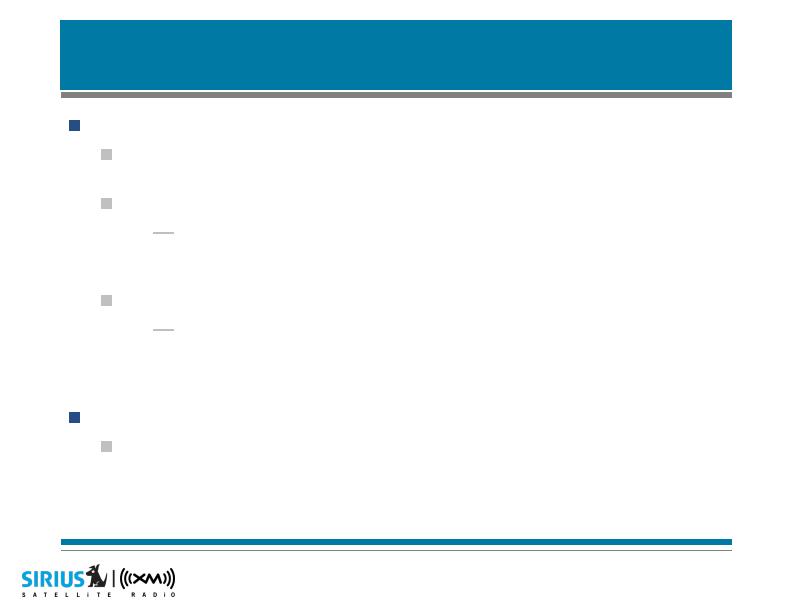
JPMorgan and Evercore working on overall financing plan

3 areas of activity:

Operational improvements

Existing debt holder discussions

New investor discussions

Looking to complete all by March 1

Capital structure initiatives

30


III. Stock Price

Stock Price and Market
Performance

31


Renewals of programming agreements at lower rates

Channel rationalization improves audio experience
and lowers programming cost

Early success up-selling customers to new “Best of”
packages

Distribution contract improvements in OEM and
Retail

Volume benefits from chipset manufacturers,
transaction fees, etc.

Benefits of the merger are significant

32


Best practices implementation at call centers and in
retention programs should over time improve churn
and conversion rates

Employee head count down significantly

Significant reduction in marketing spending

Rationalization of price points for aftermarket products

Benefits of the merger are significant

33


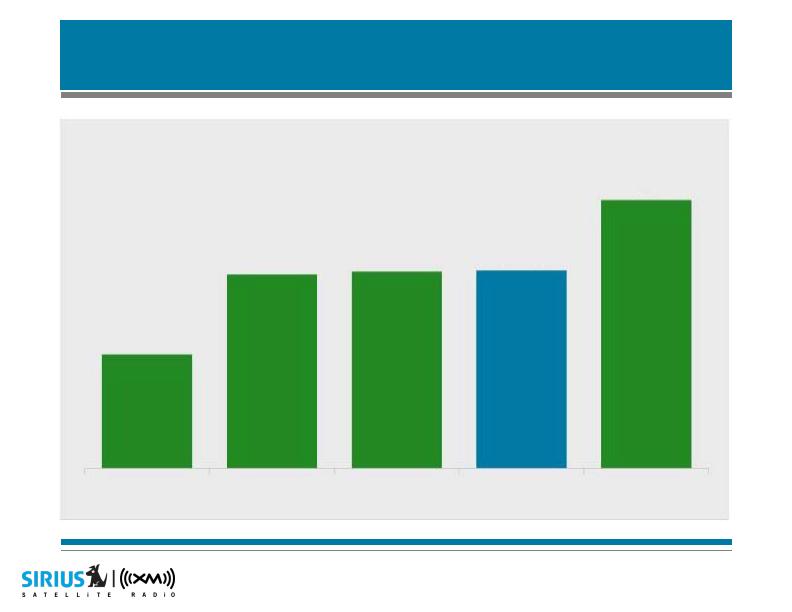
Enterprise value / revenue comparison

Source: Company filings, Capital IQ, or Yahoo

34

1.43

1.45

1.46

1.98

0.84

Dish Network

DirecTV

TWX

SIRIUS XM

Apple


Financial performance disconnected from
valuation

SIRIUS 2003

SIRIUS 2005

SIRIUS XM 2008E

Subs: 261K

Revenue: $12.9 M

=

Debt + Equity:
$3.4B

Subs: 3.3 M

Revenue: $242 M

=

Debt + Equity:
$10.0B

Subs: 19.1 M

Revenue: $2.4 B

=

Debt + Equity:
$3.5B

Source: Company filings, Capital IQ, or Yahoo

35


Management priorities

Resolving 2009 liquidity

Maximizing synergies, EBITDA, and FCF

Maintaining growth

Enhancing shareholder value

36


IV. Q & A

Questions and Answers

37


In order to provide projections with respect to non-GAAP measures, we are required to estimate GAAP
measures that are components of these reconciliations. The provision of these estimates is in no way meant
to indicate that the company is explicitly or implicitly providing projections on those GAAP components of the
reconciliations.  In order to reconcile the non-GAAP financial measures to GAAP, the company has estimated
the GAAP components that arithmetically add up to the non-GAAP financial measures.  The company fully
expects that the estimates used for the GAAP components will vary from actual results.

Adjusted EBITDA Reconciliation

2009E

2010E

2011E

2012E

2013E

Income / (Loss) From Operations

($0.1)

$0.3

$0.5

$0.9

$1.1

Add: Equity Expense

$0.1

$0.1

$0.1

$0.1

$0.1

Add: Depreciation & Amortization

$0.2

$0.2

$0.3

$0.3

$0.3

Adjusted EBITDA

$0.3

$0.6

$0.9

$1.3

$1.5

Free Cash Flow Reconciliation

Net Change in Cash & Cash

Equivalents

$0.0

$0.3

$0.4

$0.8

$0.9

Add: Cash Flow from Financing

($0.0)

$0.0

$0.2

$0.2

$0.5

Add: Other Investing

($0.0)

$0.0

($0.0)

$0.0

$0.0

Free Cash Flow

$0.0

$0.4

$0.6

$1.0

$1.4

A reconciliation of Adjusted EBITDA and Free Cash Flow contained in the company’s projections to their most
comparable financial measure calculated and presented in accordance with GAAP is set forth below:

38

GAAP reconciliation


Disclaimer on forward-looking statements

The guidance contained herein are based upon a number of assumptions and estimates that, while considered reasonable by us when taken as a whole, are
inherently subject to significant business, economic and competitive uncertainties and contingencies, many of which are beyond our control.  In addition, the
guidance is based upon specific assumptions with respect to future business conditions, some or all of which will change.  The guidance, like any forecast, is
necessarily speculative in nature and it can be expected that the assumptions upon which the guidance is based will not prove to be valid or will vary from actual
results.  Actual results will vary from the guidance and the variations may be material.  Consequently, the guidance should not be regarded as a representation by us
or any other person that the subscribers, synergies, revenue, and adjusted EBITDA will actually be achieved.  You are cautioned not to place undue reliance on this
information.

This communication contains “forward-looking statements” within the meaning of the Private Securities Litigation Reform Act of 1995.  Such statements include, but
are not limited to, statements about the benefits of the business combination transaction involving SIRIUS and XM, including potential synergies and cost savings
and the timing thereof, future financial and operating results, the combined company’s plans, objectives, expectations and intentions with respect to future
operations, products and services; and other statements identified by words such as “anticipate,” “believe,” “plan,” “estimate,” “expect,” “intend,” “will,” “should,”
“may,” or words of similar meaning.  Such forward-looking statements are based upon the current beliefs and expectations of SIRIUS’ and XM’s management and
are inherently subject to significant business, economic and competitive uncertainties and contingencies, many of which are difficult to predict and generally beyond
the control of SIRIUS and XM.  Actual results may differ materially from the results anticipated in these forward-looking statements. 

The following factors, among others, could cause actual results to differ materially from the anticipated results or other expectations expressed in the forward-looking
statement: general business and economic conditions; the performance of financial markets and interest rates; the ability to obtain governmental approvals of the
transaction on a timely basis; the failure to realize synergies and cost-savings from the transaction or delay in realization thereof; the businesses of SIRIUS and XM
may not be combined successfully, or such combination may take longer, be more difficult, time-consuming or costly to accomplish than expected; and operating
costs and business disruption following the merger, including adverse effects on employee retention and on our business relationships with third parties, including
manufacturers of radios, retailers, automakers and programming providers.  Additional factors that could cause SIRIUS’ and XM’s results to differ materially from
those described in the forward-looking statements can be found in SIRIUS’ and XM’s Annual Reports on Form 10-K for the year ended December 31, 2007 and their
respective Quarterly Reports on Form 10-Q for the quarter ended September 30, 2008, which are filed with the Securities and Exchange Commission (the "SEC")
and available at the SEC’s Internet site (
http://www.sec.gov).  The information set forth herein speaks only as of the date hereof, and SIRIUS and XM disclaim any
intention or obligation to update any forward looking statements as a result of developments occurring after the date of this communication.

39


JOHN MADDEN

TONY STEWART

MARTHA STEWART

HOWARD STERN

BOB DYLAN

FRANK SINATRA

BRUCE SPRINGSTEEN

JAMIE FOXX

CAL RIPKEN

OPRAH WINFREY