Exhibit 99.1
Annual Stockholder Meeting May 21, 2013
The guidance contained herein is based upon a number of assumptions and estimates that, while considered reasonable by us when taken as a whole, is inherently subject to significant business, economic and competitive uncertainties and contingencies, many of which are beyond our control . In addition, the guidance is based upon specific assumptions with respect to future business conditions, some or all of which will change . The guidance, like any forecast, is necessarily speculative in nature and it can be expected that the assumptions upon which the guidance is based will not prove to be valid or will vary from actual results . Actual results will vary from the guidance and the variations may be material . Consequently, the guidance should not be regarded as a representation by us or any other person that the subscribers, revenue , and/or adjusted EBITDA will actually be achieved . You are cautioned not to place undue reliance on this information . This communication contains “forward - looking statements” within the meaning of the Private Securities Litigation Reform Act of 1995 . Such statements include, but are not limited to, statements about future financial and operating results, our plans, objectives, expectations and intentions with respect to future operations, products and services ; and other statements identified by words such as “will likely result,” “are expected to,” “will continue,” “is anticipated,” “estimated,” “believe,” “intend,” “plan,” “projection,” “outlook” or words of similar meaning . Such forward - looking statements are based upon the current beliefs and expectations of our management and are inherently subject to significant business, economic and competitive uncertainties and contingencies, many of which are difficult to predict and generally beyond our control . Actual results may differ materially from the results anticipated in these forward - looking statements . Disclaimer on Forward - Looking Statements
The following factors, among others, could cause actual results to differ materially from the anticipated results or other expectations expressed in the forward - looking statements : • we face substantial competition and that competition is likely to increase over time ; • our business depends in large part upon automakers ; • general economic conditions can affect our business ; • failure of our satellites would significantly damage our business ; • our ability to attract and retain subscribers at a profitable level in the future is uncertain ; • royalties for music rights have increased and may continue to do so in the future ; • o ur business could be adversely affected if we fail to attract and retain qualified executive officers ; • t he unfavorable outcome of pending or future litigation could have a material adverse effect ; • rapid technological and industry changes could adversely impact our services ; • failure of third parties to perform could adversely affect our business ; • changes in consumer protection laws and their enforcement could damage our business ; • failure to comply with FCC requirements could damage our business ; • o ther existing or future government laws and regulations could harm our business ; • interruption or failure of our information technology and communication systems could n egatively impact our results and brand ; • if we fail to protect the security of personal information about our customers, we could be subject to costly government enforcement actions or private litigation and our reputation could suffer ; • we may from time to time modify our business plan, and these changes could adversely affect us and our financial condition ; • our indebtedness could adversely affect our operations and could limit our ability to react to changes in the economy or our industry ; • our broadcast studios, terrestrial repeater networks, satellite uplink facilities or other ground facilities could be damaged by natural catastrophes or terrorist activities ; • o ur principal stockholder has significant influence over our management and over actions requiring stockholder approval and its interests may differ from the interests of other holders of common stock ; • w e are a "controlled company" within the meaning of the NASDAQ listing rules and, as a result, qualify for, and rely on, exemptions from certain corporate governance requirements ; • our business may be impaired by third - party intellectual property rights . Additional factors that could cause our results to differ materially from those described in the forward - looking statements can be found in our reports filed with or furnished to the SEC and available at the SEC’s Internet site (http : //www . sec . gov) . The information set forth herein speaks only as of the date hereof, and we disclaim any intention or obligation to update any forward looking statements as a result of developments occurring after the date of this communication . Disclaimer on Forward - Looking Statements
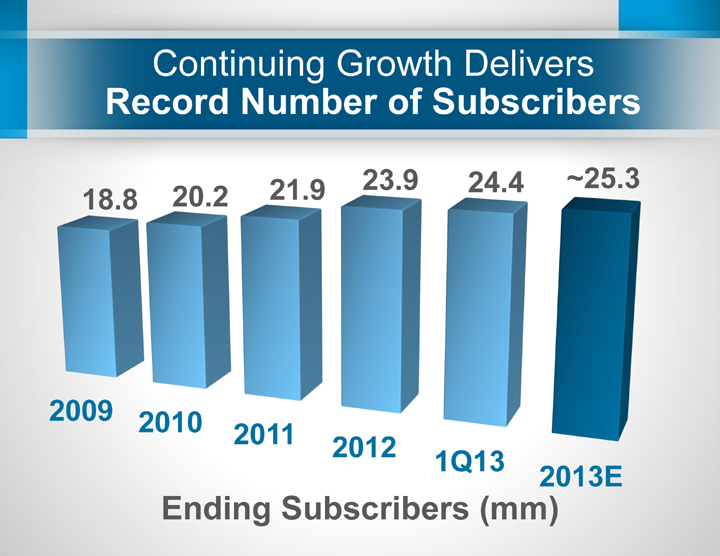
Ending Subscribers ( mm) Continuing Growth Delivers Record Number of Subscribers 2009 2010 2011 2012 1Q13 2013E 18.8 20.2 21.9 23.9 24.4 ~25.3
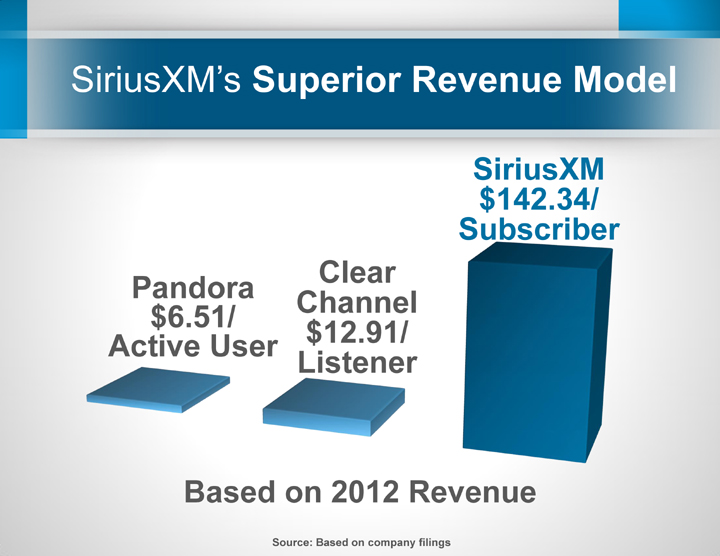
Clear Channel $12.91/ Listener Based on 2012 Revenue SiriusXM $142.34/ Subscriber Pandora $6.51/ Active User Source: Based on company filings SiriusXM’s Superior Revenue Model
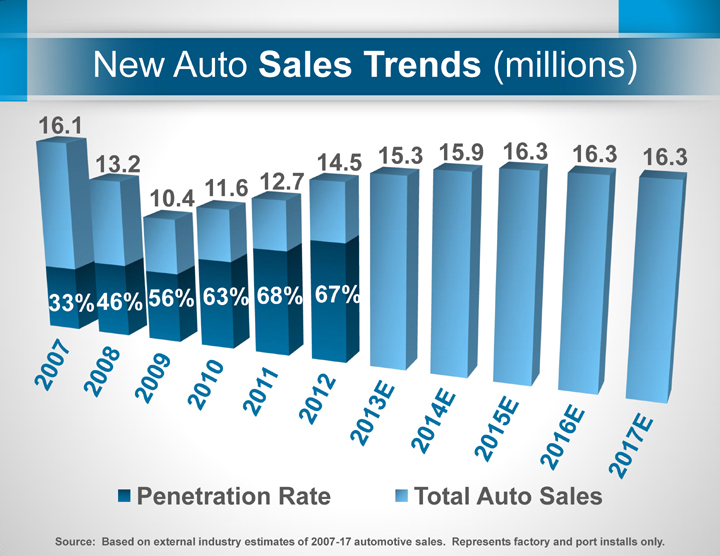
Source: Based on external industry estimates of 2007 - 17 automotive sales. Represents factory and port installs only. New Auto Sales Trends (millions) 33% 46% 56% 63% 68% 67% 16.1 13.2 10.4 11.6 12.7 14.5 15.3 15.9 16.3 16.3 16.3 Penetration Rate Total Auto Sales
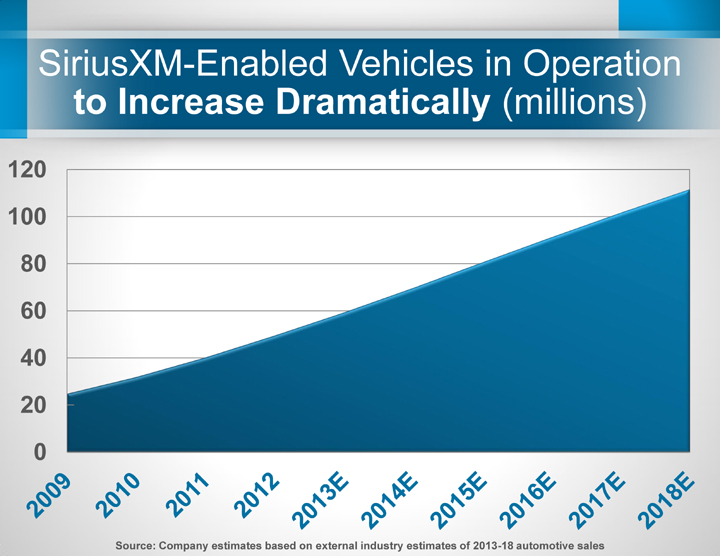
0 20 40 60 80 100 120 SiriusXM - Enabled Vehicles in Operation to Increase Dramatically (millions) Source: Company estimates based on external industry estimates of 2013 - 18 automotive sales
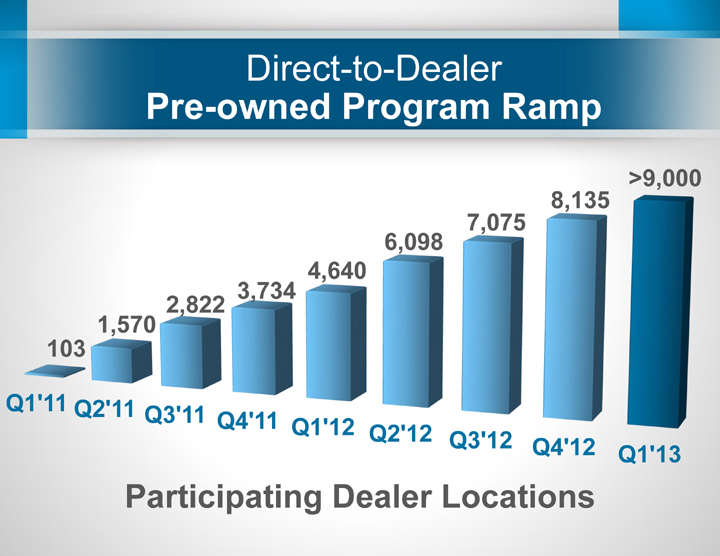
Direct - to - Dealer Pre - owned Program Ramp Q1'11 Q2'11 Q3'11 Q4'11 Q1'12 Q2'12 Q3'12 Q4'12 Q1'13 103 1,570 2,822 3,734 4,640 6,098 7,075 8,135 >9,000 Participating Dealer Locations
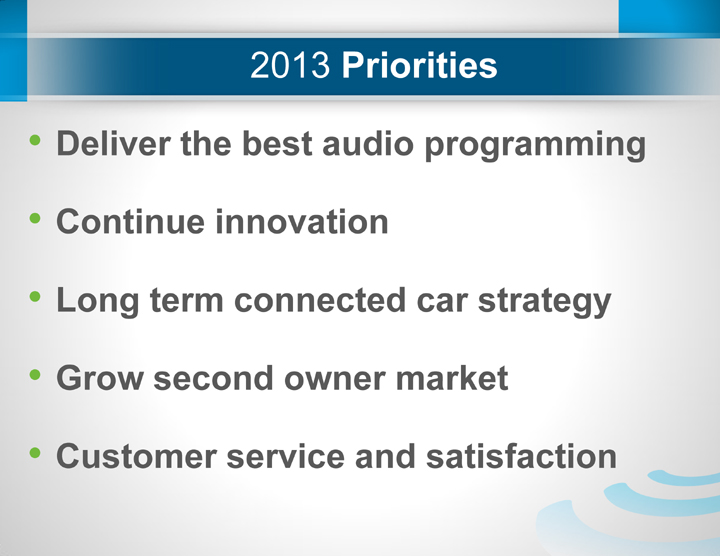
2013 Priorities • Deliver the best audio programming • Continue innovation • Long term c onnected c ar s trategy • Grow second o wner m arket • Customer s ervice and satisfaction

Programming and Content Objectives • Expand rights and exclusivity • Develop and promote home grown talent • Evolve our formats • Pursue new and unique brands/talent • Engage subscribers with events and loyalty programs
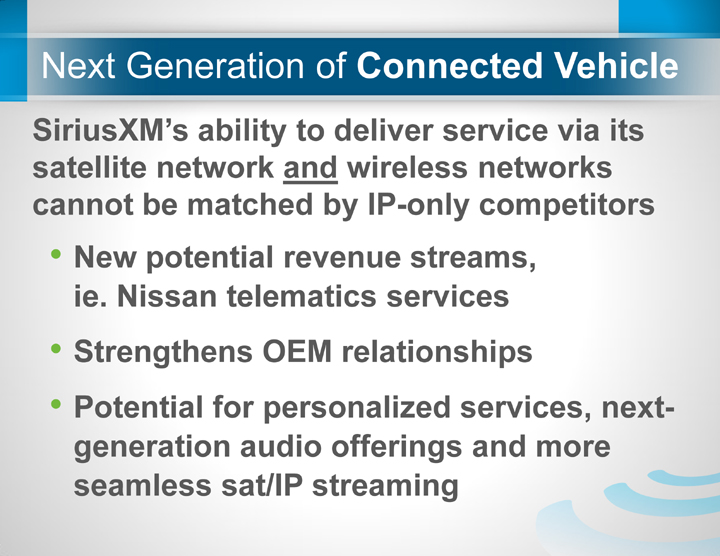
Next Generation of Connected Vehicle SiriusXM’s ability to deliver service via its satellite network and wireless networks cannot be matched by IP - only competitors • New potential revenue streams, ie . Nissan telematics services • Strengthens OEM relationships • Potential for personalized services, next - generation audio offerings and more seamless sat/IP streaming
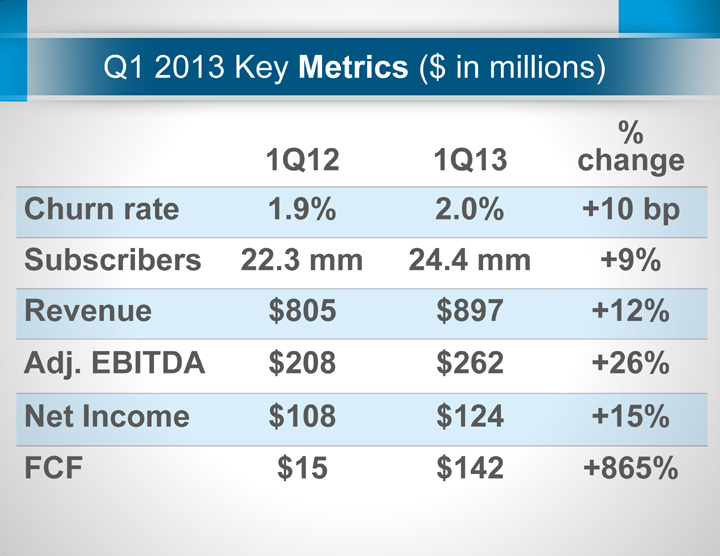
Q1 2013 Key Metrics ($ in millions) 1Q12 1Q13 % change Churn rate 1.9% 2.0% +10 bp Subscribers 22.3 mm 24.4 mm +9% Revenue $805 $897 +12% Adj. EBITDA $208 $262 +26% Net Income $108 $124 +15% FCF $15 $142 +865%
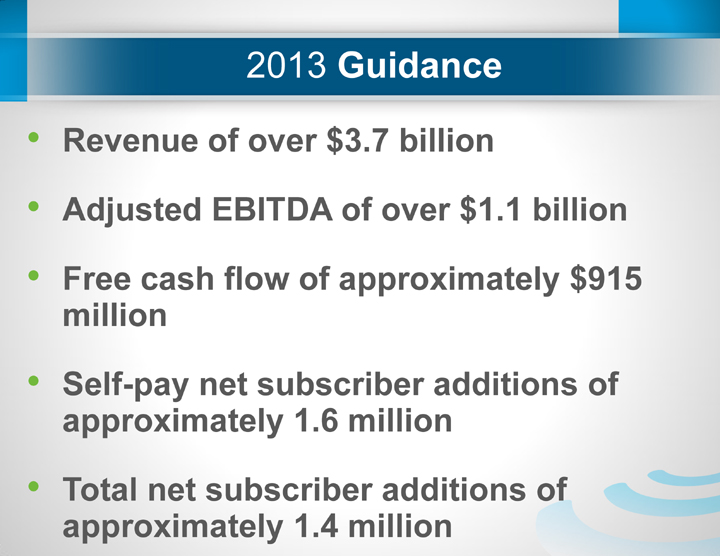
2013 Guidance • Revenue of over $3.7 billion • Adjusted EBITDA of over $1.1 billion • Free cash flow of approximately $915 million • Self - pay net subscriber additions of approximately 1.6 million • Total net subscriber additions of approximately 1.4 million
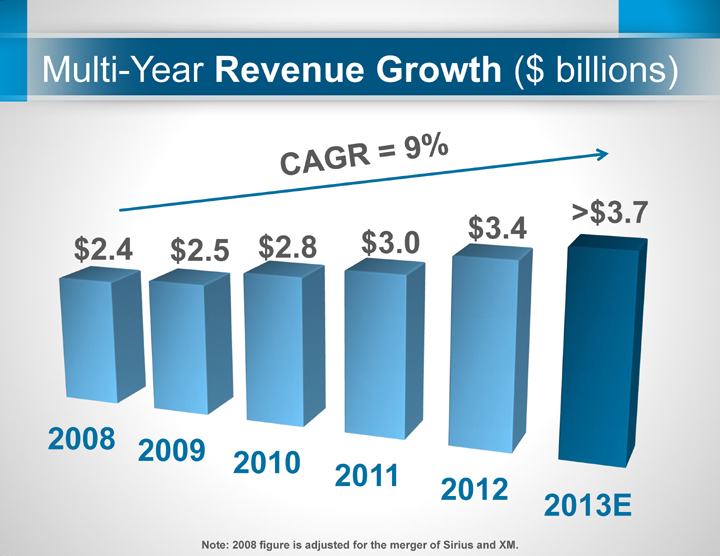
Multi - Year Revenue Growth ($ billions) 2008 2009 2010 2011 2012 2013E $2.4 $2.5 $2.8 $3.0 $ 3.4 >$ 3.7 Note: 2008 figure is adjusted for the merger of Sirius and XM .
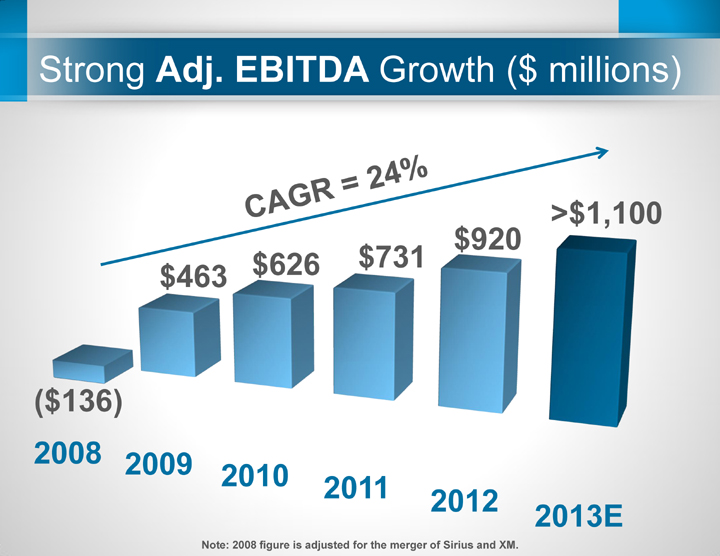
2008 2009 2010 2011 2012 2013E ($136) $463 $626 $731 $920 >$ 1,100 Strong Adj. EBITDA Growth ($ millions) Note: 2008 figure is adjusted for the merger of Sirius and XM .
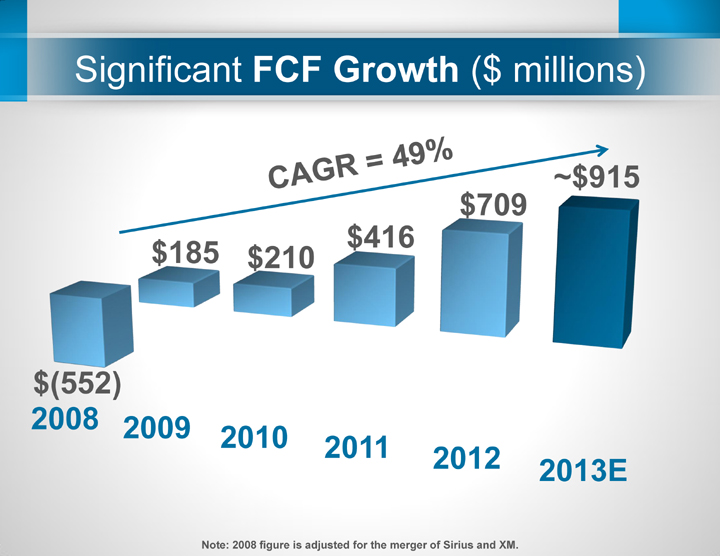
2008 2009 2010 2011 2012 2013E $(552) $185 $210 $416 $709 ~$ 915 Significant FCF Growth ($ millions) Note: 2008 figure is adjusted for the merger of Sirius and XM .
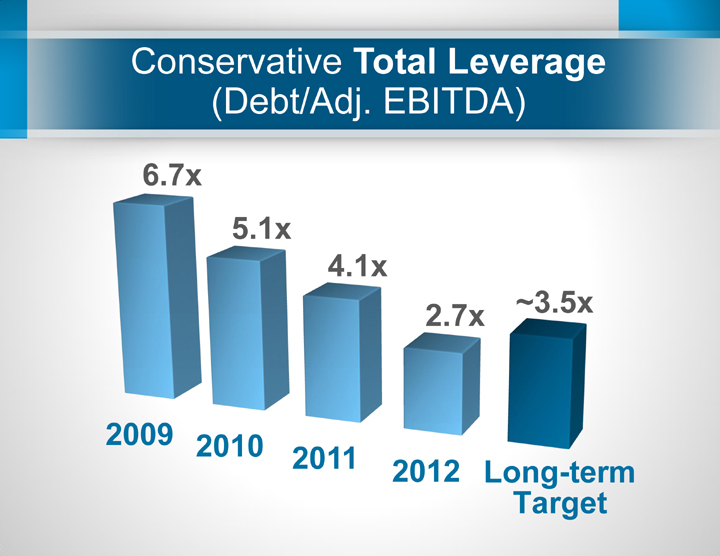
Conservative Total Leverage (Debt/Adj. EBITDA ) 2009 2010 2011 2012 6.7x 5.1x 4.1x 2.7x ~3.5x Long - term T arget
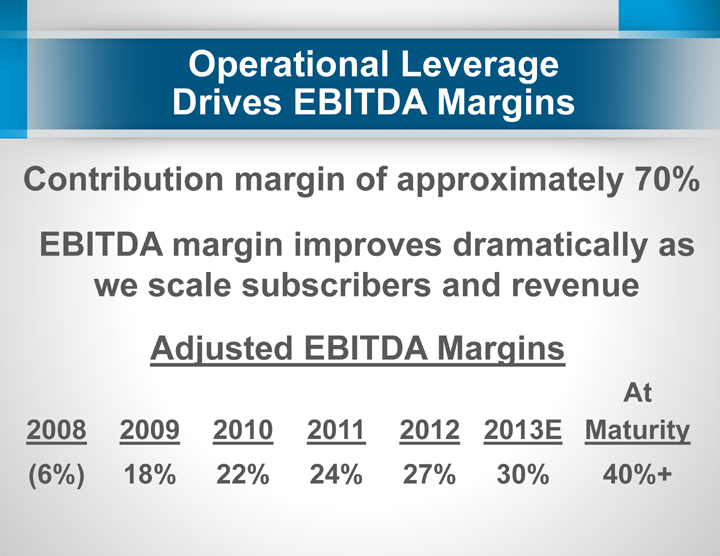
Operational Leverage Drives EBITDA Margins Contribution margin of approximately 70% Adjusted EBITDA Margins 2008 2009 2010 2011 2012 2013E At Maturity (6%) 18% 22% 24% 27% 30% 40%+ EBITDA margin improves dramatically as we scale subscribers and revenue
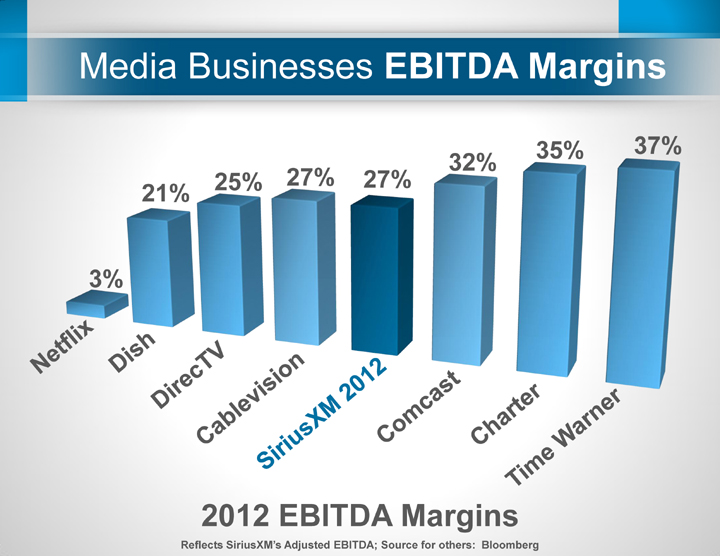
3% 21% 25% 27% 27% 32% 35% 37% Media Businesses EBITDA Margins 2012 EBITDA Margins Reflects SiriusXM’s Adjusted EBITDA; Source for others: Bloomberg
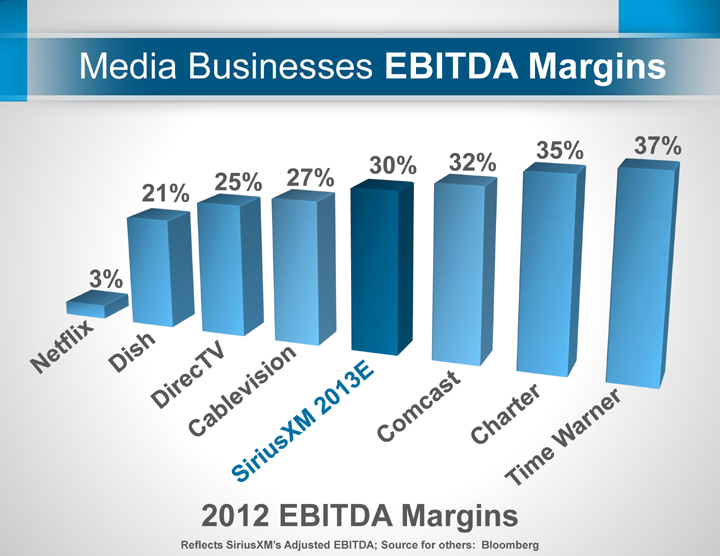
3% 21% 25% 27% 30% 32% 35% 37% Media Businesses EBITDA Margins 2012 EBITDA Margins Reflects SiriusXM’s Adjusted EBITDA; Source for others: Bloomberg
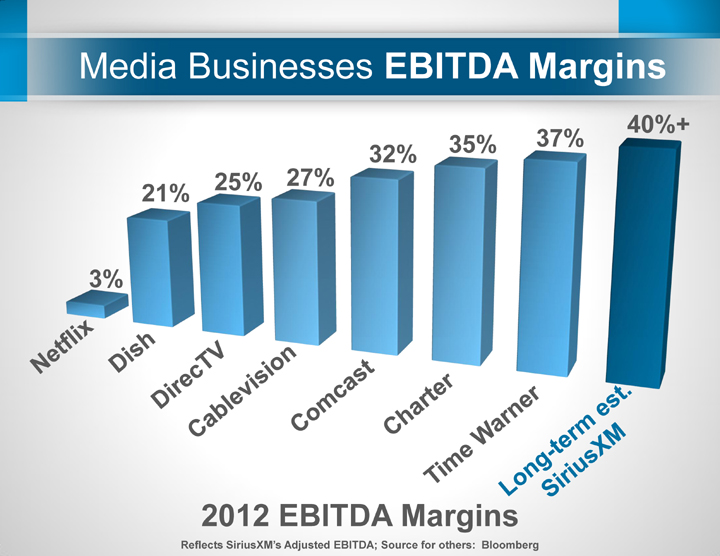
3% 21% 25% 27% 32% 35% 37% 40 %+ Media Businesses EBITDA Margins 2012 EBITDA Margins Reflects SiriusXM’s Adjusted EBITDA; Source for others: Bloomberg
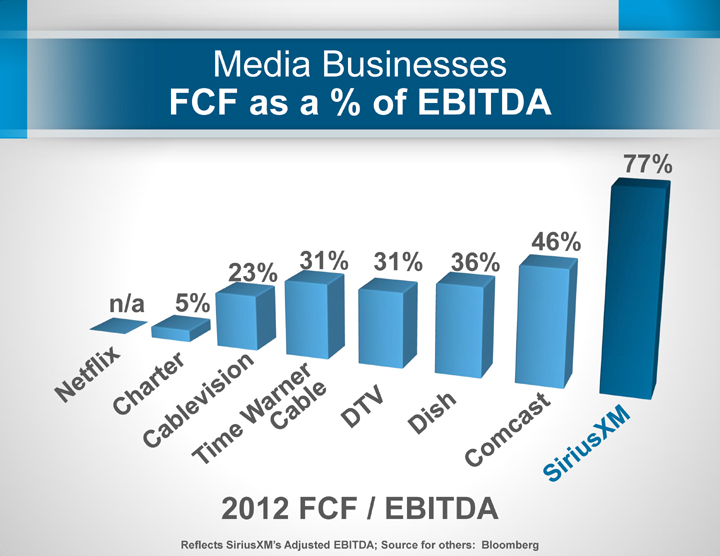
Media Businesses FCF as a % of EBITDA n/a 5% 23% 31% 31% 36% 46% 77% 2012 FCF / EBITDA Reflects SiriusXM’s Adjusted EBITDA; Source for others: Bloomberg
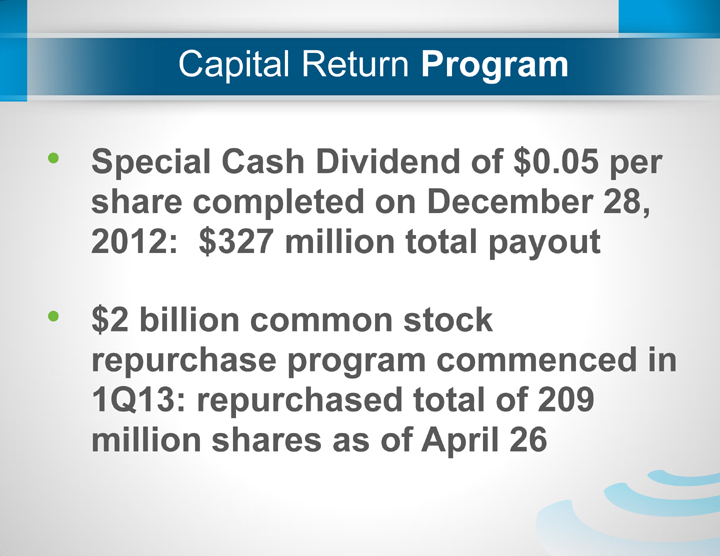
Capital Return Program • Special Cash Dividend of $0.05 per share completed on December 28, 2012: $327 million total payout • $2 billion common stock repurchase program commenced in 1Q13: repurchased total of 209 million shares as of April 26
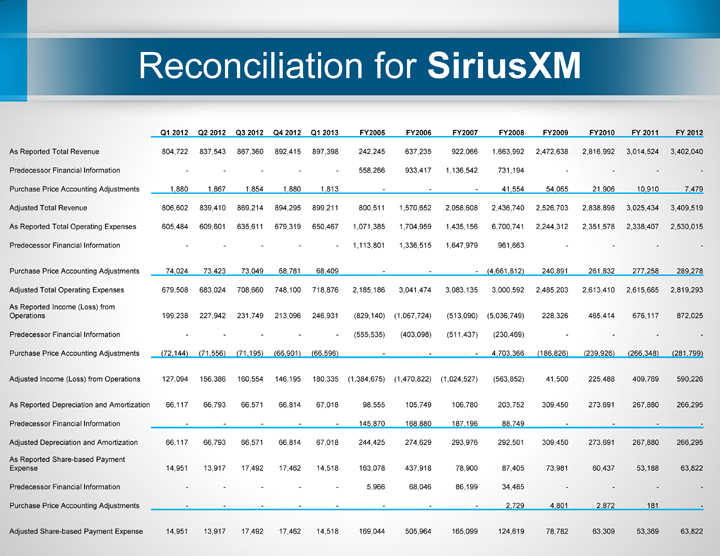
Reconciliation for SiriusXM Q1 2012 Q2 2012 Q3 2012 Q4 2012 Q1 2013 FY2005 FY2006 FY2007 FY2008 FY2009 FY2010 FY 2011 FY 2012 As Reported Total Revenue 804,722 837,543 867,360 892,415 897,398 242,245 637,235 922,066 1,663,992 2,472,638 2,816,992 3,014,524 3,402,040 Predecessor Financial Information - - - - - 558,266 933,417 1,136,542 731,194 - - - - Purchase Price Accounting Adjustments 1,880 1,867 1,854 1,880 1,813 - - - 41,554 54,065 21,906 10,910 7,479 Adjusted Total Revenue 806,602 839,410 869,214 894,295 899,211 800,511 1,570,652 2,058,608 2,436,740 2,526,703 2,838,898 3,025,434 3,409,519 As Reported Total Operating Expenses 605,484 609,601 635,611 679,319 650,467 1,071,385 1,704,959 1,435,156 6,700,741 2,244,312 2,351,578 2,338,407 2,530,015 Predecessor Financial Information - - - - - 1,113,801 1,336,515 1,647,979 961,663 - - - - Purchase Price Accounting Adjustments 74,024 73,423 73,049 68,781 68,409 - - - (4,661,812) 240,891 261,832 277,258 289,278 Adjusted Total Operating Expenses 679,508 683,024 708,660 748,100 718,876 2,185,186 3,041,474 3,083,135 3,000,592 2,485,203 2,613,410 2,615,665 2,819,293 As Reported Income (Loss) from Operations 199,238 227,942 231,749 213,096 246,931 (829,140) (1,067,724) (513,090) (5,036,749) 228,326 465,414 676,117 872,025 Predecessor Financial Information - - - - - (555,535) (403,098) (511,437) (230,469) - - - - Purchase Price Accounting Adjustments (72,144) (71,556) (71,195) (66,901) (66,596) - - - 4,703,366 (186,826) (239,926) (266,348) (281,799) Adjusted Income (Loss) from Operations 127,094 156,386 160,554 146,195 180,335 (1,384,675) (1,470,822) (1,024,527) (563,852) 41,500 225,488 409,769 590,226 As Reported Depreciation and Amortization 66,117 66,793 66,571 66,814 67,018 98,555 105,749 106,780 203,752 309,450 273,691 267,880 266,295 Predecessor Financial Information - - - - - 145,870 168,880 187,196 88,749 - - - - Adjusted Depreciation and Amortization 66,117 66,793 66,571 66,814 67,018 244,425 274,629 293,976 292,501 309,450 273,691 267,880 266,295 As Reported Share - based Payment Expense 14,951 13,917 17,492 17,462 14,518 163,078 437,918 78,900 87,405 73,981 60,437 53,188 63,822 Predecessor Financial Information - - - - - 5,966 68,046 86,199 34,485 - - - - Purchase Price Accounting Adjustments - - - - - - - - 2,729 4,801 2,872 181 - Adjusted Share - based Payment Expense 14,951 13,917 17,492 17,462 14,518 169,044 505,964 165,099 124,619 78,782 63,309 53,369 63,822
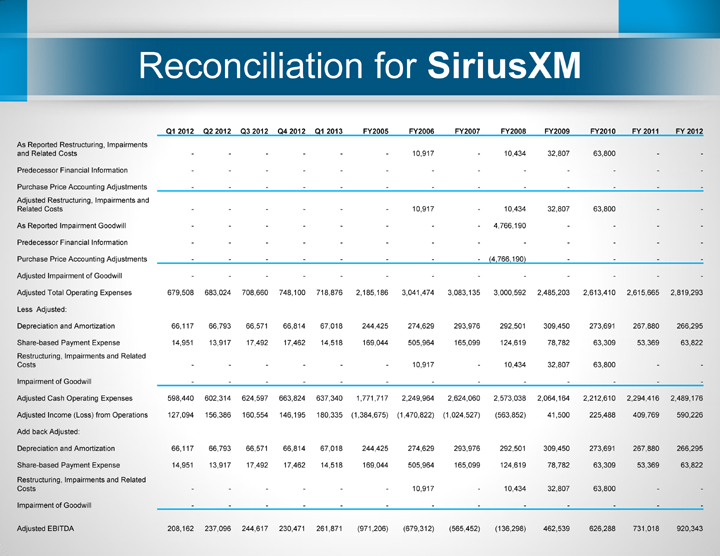
Reconciliation for SiriusXM Q1 2012 Q2 2012 Q3 2012 Q4 2012 Q1 2013 FY2005 FY2006 FY2007 FY2008 FY2009 FY2010 FY 2011 FY 2012 As Reported Restructuring, Impairments and Related Costs - - - - - - 10,917 - 10,434 32,807 63,800 - - Predecessor Financial Information - - - - - - - - - - - - - Purchase Price Accounting Adjustments - - - - - - - - - - - - - Adjusted Restructuring, Impairments and Related Costs - - - - - - 10,917 - 10,434 32,807 63,800 - - As Reported Impairment Goodwill - - - - - - - - 4,766,190 - - - - Predecessor Financial Information - - - - - - - - - - - - - Purchase Price Accounting Adjustments - - - - - - - - (4,766,190) - - - - Adjusted Impairment of Goodwill - - - - - - - - - - - - - Adjusted Total Operating Expenses 679,508 683,024 708,660 748,100 718,876 2,185,186 3,041,474 3,083,135 3,000,592 2,485,203 2,613,410 2,615,665 2,819,293 Less Adjusted: Depreciation and Amortization 66,117 66,793 66,571 66,814 67,018 244,425 274,629 293,976 292,501 309,450 273,691 267,880 266,295 Share - based Payment Expense 14,951 13,917 17,492 17,462 14,518 169,044 505,964 165,099 124,619 78,782 63,309 53,369 63,822 Restructuring, Impairments and Related Costs - - - - - - 10,917 - 10,434 32,807 63,800 - - Impairment of Goodwill - - - - - - - - - - - - - Adjusted Cash Operating Expenses 598,440 602,314 624,597 663,824 637,340 1,771,717 2,249,964 2,624,060 2,573,038 2,064,164 2,212,610 2,294,416 2,489,176 Adjusted Income (Loss) from Operations 127,094 156,386 160,554 146,195 180,335 (1,384,675) (1,470,822) (1,024,527) (563,852) 41,500 225,488 409,769 590,226 Add back Adjusted: Depreciation and Amortization 66,117 66,793 66,571 66,814 67,018 244,425 274,629 293,976 292,501 309,450 273,691 267,880 266,295 Share - based Payment Expense 14,951 13,917 17,492 17,462 14,518 169,044 505,964 165,099 124,619 78,782 63,309 53,369 63,822 Restructuring, Impairments and Related Costs - - - - - - 10,917 - 10,434 32,807 63,800 - - Impairment of Goodwill - - - - - - - - - - - - - Adjusted EBITDA 208,162 237,096 244,617 230,471 261,871 (971,206) (679,312) (565,452) (136,298) 462,539 626,288 731,018 920,343
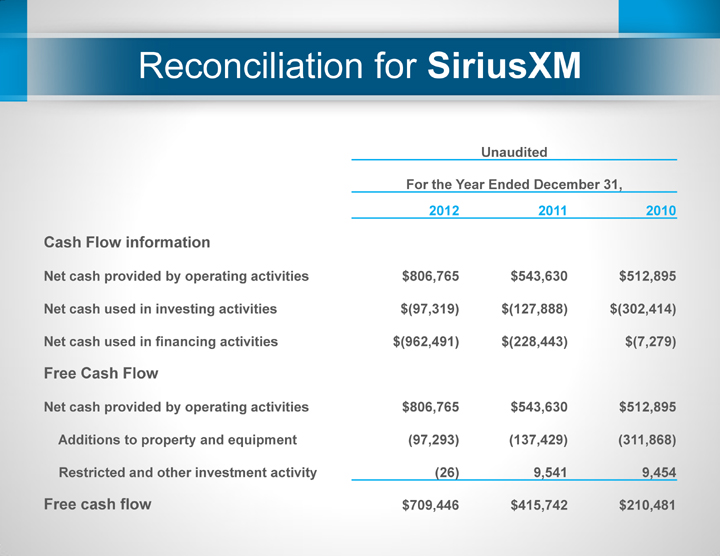
Reconciliation for SiriusXM Unaudited For the Year Ended December 31, 2012 2011 2010 Cash Flow information Net cash provided by operating activities $806,765 $543,630 $512,895 Net cash used in investing activities $(97,319) $(127,888) $(302,414) Net cash used in financing activities $(962,491) $(228,443) $(7,279) Free Cash Flow Net cash provided by operating activities $806,765 $543,630 $512,895 Additions to property and equipment (97,293) (137,429) (311,868) Restricted and other investment activity (26) 9,541 9,454 Free cash flow $709,446 $415,742 $210,481