Annual Meeting of Stockholders
MAY 27, 2009

Disclaimer on forward-looking statements
The guidance contained herein are based upon a number of assumptions and estimates that, while considered reasonable by us when taken as a whole, are inherently subject to significant business, economic and competitive uncertainties and contingencies, many of which are beyond our control. In addition, the guidance is based upon specific assumptions with respect to future business conditions, some or all of which will change. The guidance, like any forecast, is necessarily speculative in nature and it can be expected that the assumptions upon which the guidance is based will not prove to be valid or will vary from actual results. Actual results will vary from the guidance and the variations may be material. Consequently, the guidance should not be regarded as a representation by us or any other person that the subscribers, synergies, revenue, and adjusted EBITDA will actually be achieved. You are cautioned not to place undue reliance on this information.
This communication contains “forward-looking statements” within the meaning of the Private Securities Litigation Reform Act of 1995. Such statements include, but are not limited to, statements about the benefits of the business combination transaction involving SIRIUS and XM, including potential synergies and cost savings and the timing thereof, future financial and operating results, the combined company’s plans, objectives, expectations and intentions with respect to future operations, products and services; and other statements identified by word such as “will likely result,” “are expected to,” “anticipate,” “believe,” “plan,” “estimate,” “intend,” “will,” “should,” “may,” or words of similar meaning. Such forward-looking statements are based upon the current beliefs and expectations of SIRIUS’ and XM’s management and are inherently subject to significant business, economic and competitive uncertainties and contingencies, many of which are difficult to predict and generally beyond the control of SIRIUS and XM. Actual results may differ materially from the results anticipated in these forward-looking statements.
The following factors, among others, could cause actual results to differ materially from the anticipated results or other expectations expressed in the forward-looking statement: our substantial indebtedness; the businesses of SIRIUS and XM may not be combined successfully, or such combination may take longer, be more difficult, time-consuming or costly to accomplish than expected; the useful life of our satellites; our dependence upon automakers and other third parties; our competitive position versus other forms of audio and video entertainment; and general economic conditions. Additional factors that could cause SIRIUS’ and XM’s results to differ materially from those described in the forward-looking statements can be found in SIRIUS’ Annual Report on Form 10-K for the year ended December 31, 2008 and XM’s Annual Report on Form 10-K for the year ended December 31, 2008, which are filed with the Securities and Exchange Commission (the “SEC”) and available at the SEC’s internet site (http://www.sec.gov). The information set forth herein speaks only as the date hereof, and SIRIUS and XM disclaim any intention or obligation to update any forward looking statements as a result of developments occurring after the date of this communication.
Corporate Priorities
Obtain license
1990-1997
< 1997
1998
1999
2000
2001
2002
2003
2004
2005
2006
2007
2008
2009 >
Corporate Priorities
Develop radio chipsets
and launch satellites
2000-2001
< 1997
1998
1999
2000
2001
2002
2003
2004
2005
2006
2007
2008
2009 >
Corporate Priorities
Develop content and
auto arrangements
2000-2004
< 1997
1998
1999
2000
2001
2002
2003
2004
2005
2006
2007
2008
2009 >
Corporate Priorities
Rapidly build subscriber base
2003-2007
< 1997
1998
1999
2000
2001
2002
2003
2004
2005
2006
2007
2008
2009 >
Corporate Priorities
Complete merger
February 2007 - July 2008
< 1997
1998
1999
2000
2001
2002
2003
2004
2005
2006
2007
2008
2009 >
Corporate Priorities
Cut costs
2008-2009
< 1997
1998
1999
2000
2001
2002
2003
2004
2005
2006
2007
2008
2009 >
Corporate Priorities
Focus on cash flow
2009 and beyond
< 1997
1998
1999
2000
2001
2002
2003
2004
2005
2006
2007
2008
2009 >

Complete Diverse Programming
Over 85 Channels of Commercial-Free Music
Live Coverage of Every Major Sport
The Best in News, Talk and Entertainment

Social Media to Drive
Subscriber Growth and Interaction
Twitter, MySpace, YouTube, Facebook

Tiered Selling Began Seven Months Ago
No price alternatives prior to merger
No base price increase before August 2011
“Best of Package”
SIRIUS
XM
Total
$9.99 packages
A la carte
544 k
204 k
748 k
97 k
4 k
Source: Company reports as of 5/17/09

Operating Costs Improve Across the Board
Programming and content
Satellite and transmission
General and administrative
10%
23%
32%
Source: Company reports

Operating Costs Improve Across the Board
Sales and marketing
Engineering, Design
& Development
Subscriber acquisition
costs
36%
48%
48%
Source: Company reports
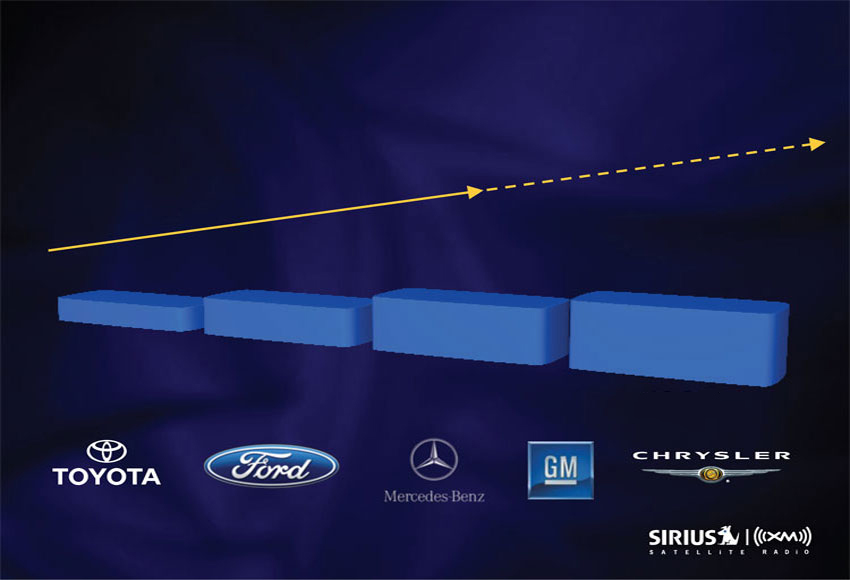
Penetration Gains at Every Major Automaker
Combined OEM penetration as
a percentage of U.S. auto sales
22%
33%
45%
53%
2006
2007
2008
1Q09
Source: Company reports
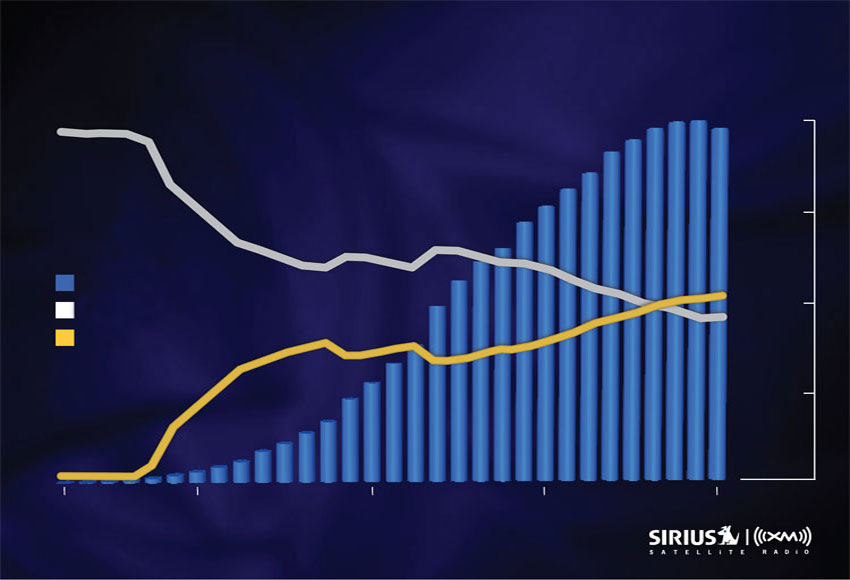
Subscriber Growth Shifts to OEM
100%
19
mm
15
mm
10
mm
5
mm
79%
61%
55%
54%
45%
46%
39%
21%
Subscribers
% Retail
% OEM
0%
2001
2002
2004
2007
2009
Source: Company reports
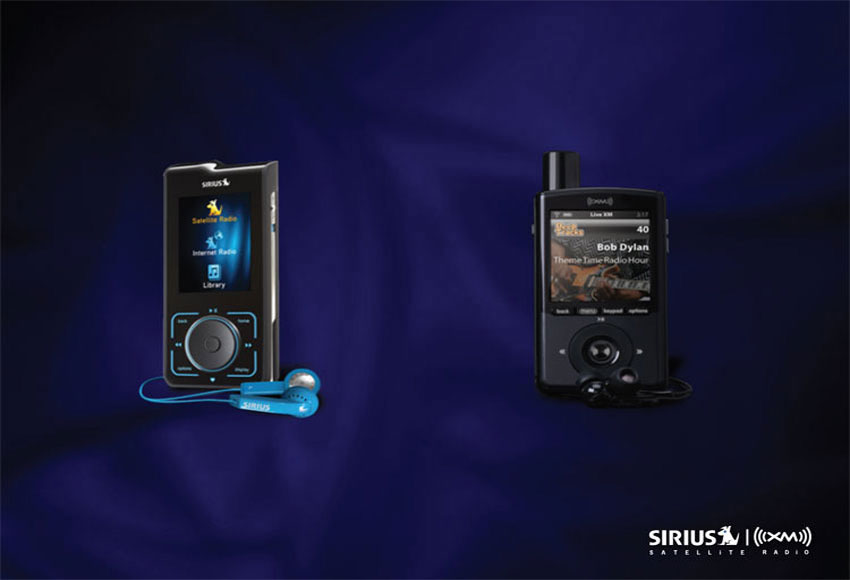
Portable Radios + MP3
Portable Stiletto 2
Portable XMp3
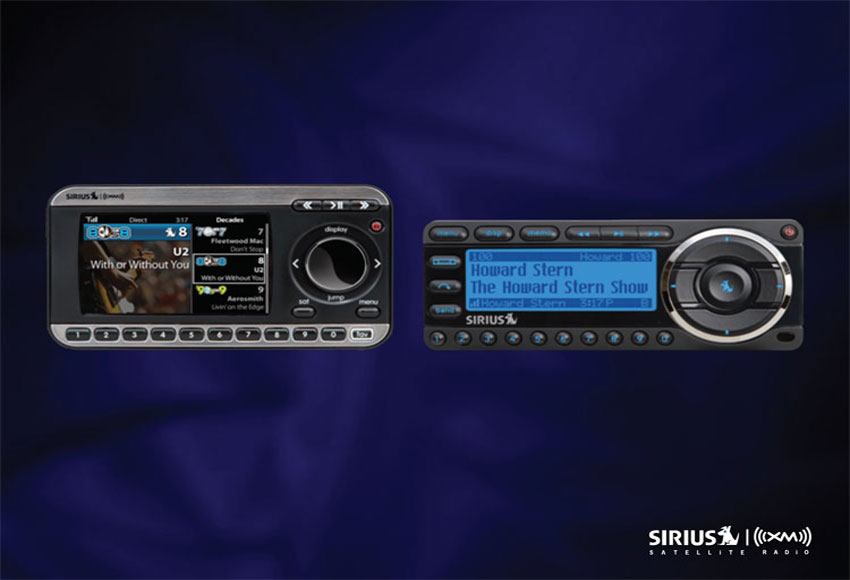
Introduced Interoperable and a la Carte Radios
MiRGE Radio
Starmate 5
Dock & Play Radio

Certified Preowned Program (CPO)
Launched with Honda, GM, Acura, Volvo,
Porsche, Volkswagen and Ford (regional)
4 additional programs to be launched soon
Low subscriber acquisition costs

Launching Apple iPhone/iPod Touch and
Smart Phone Applications

Focus on EBITDA / FCF
Will Impact Subscriber Growth
Streaming now $2.99 / month vs. free
Family plan now $8.99 / month vs. $6.99 / month
Content cost control
Improved OEM & Retail contracts
OEM penetration adjustments
Channel rationalization

Focus on Profitable Growth
Sample High
Sample Low
Converting Vehicle Converting Vehicle
Conversion Rate
70%
30%
SAC payback months
12
29
Source: SIRIUS XM estimates based on select sample data

Focus on Churn Management
4 - 5%
4.20%
2.20%
1.83%
1.33%
HBO/
Showtime/
Starz
Netflix
SIRIUS|XM
Dish
DTV
Source: Company reports and estimates

Growth Statistics and Improvements
PF 1Q08
PF 1Q09
% Improvement
Adjusted EBITDA
($70) mm
$109 mm
NMF
Subscribers
Revenue
Cash operating
expenses
17.9 mm
$579 mm
$649 mm
18.6 mm
$606 mm
$497 mm
(23%)
5%
3%
Source: Most recent Sirius XM 10Q filing. Figures are pro forma
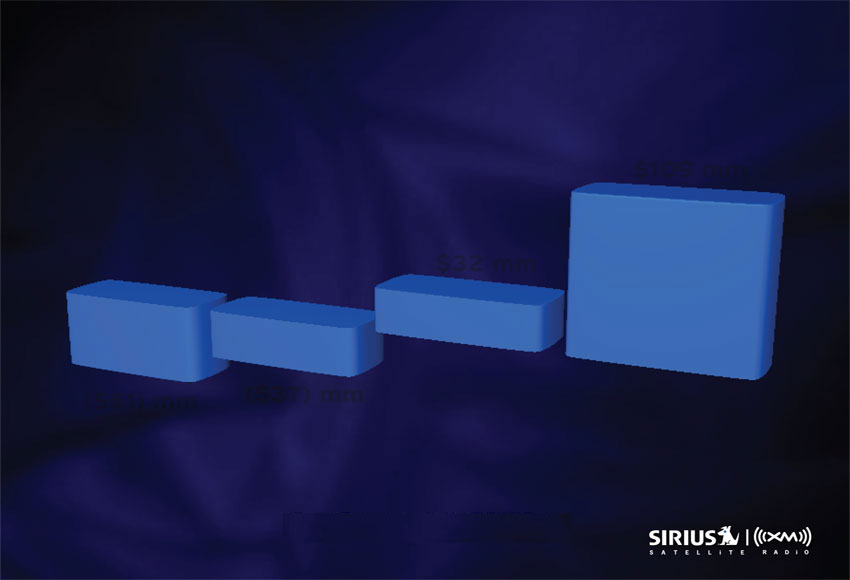
SIRIUS XM is Now a Cash Flow Growth Story
($61) mm
($37) mm
$32 mm
$109 mm
2Q08
3Q08
4Q08
1Q09
Pro Forma Adj. EBITDA
Source: Company reports

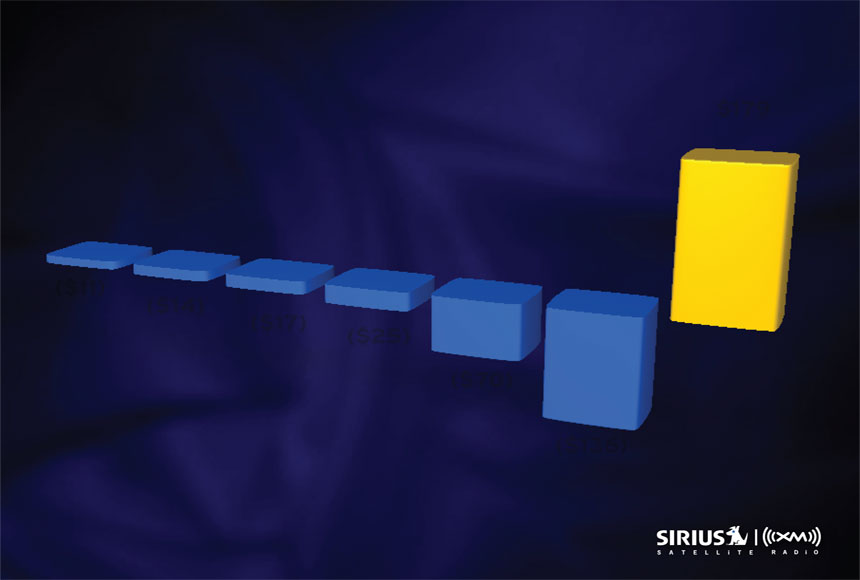
SIRIUS XM is Now the Largest Radio
Company based on First Quarter Revenue
(-24%)
$55
(-21%)
$75
(-23%)
$76
(-23%)
$159
(-29%)
$260
(-22%)
$604
(+5%)
$606
Cumulus
Entercom
Cox Radio
Citadel
CBS Radio
Clear Channel
SIRIUS|XM
1Q09 Radio Revenue (% change versus 1Q08)
Source: Company reports
Adjusted EBITDA: Change in First Quarter
Versus Year Ago
($11)
Cumulus
($14)
Entercom
($17)
Cox Radio
($25)
Citadel
($70)
CBS Radio
($136)
Clear Channel
$179
SIRIUS|XM
Source: Company reports

Internet Radio Searches for Business Model
$2.4 B
<$25 M
<$100 M
<$100 M
$161 M
Pandora
lastFM.com
Slacker
Rhapsody/
RadioPass
SIRIUS XM
|
2008 Revenue
Source: Company reports and estimates
Pro Forma Adjusted EBITDA: Now Expecting
More than $350 mm in 2009
Above
$350 mm
($136) mm
($679) mm ($566) mm
($971) mm
2005
2006
2007
2008
2009
Guidance increased from more than $300 mm
Source: Company reports
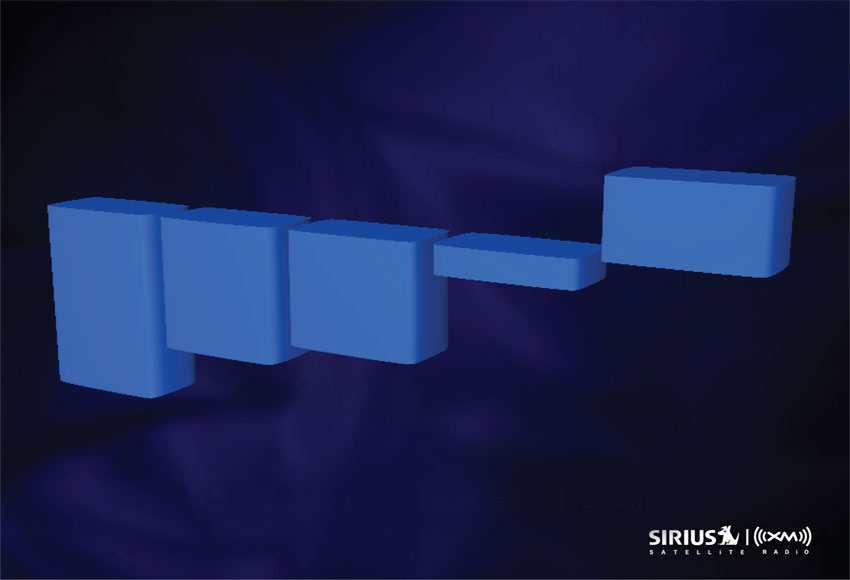
Satellite Expenditures
Sharply Reduced After 2011
SIRIUS
1, 2, & 3
XM
1 & 2
XM
3
XM
4
SIRIUS
5
SIRIUS
6
XM
5
2000 2001 2002 2003 2004 2005 2006 2007 2008 2009 2010 2011
LAUNCH DATE

Completed Refinancing
Firm plan to meet all 2009 / 2010 maturities
Liberty Media committed to $530 mm,
received a 40% equity stake
Bank debt renewed and extended

Debt Maturities ($ millions)
$339
$180
$632
$485
$1,279
$555
2009
2010
2011
2012
2013
2014
Source: Company reports

Strong Market Value
SIRIUS|XM is the 140th most valuable
company on NASDAQ (out of nearly
3,000 companies)
Other companies with similar valuations:
DreamWorks and Netflix
Source: NASDAQ as of May 20, 2009
Improved Market Value
$457 Million
12/18/08
$2.3 Billion
Up 393%
5/22/09
Source: NASDAQ and company reports

Highlights of the Past Year
Closed merger (17 months)
Refinanced $2.2 billion of $3.3 billion debt
Seamless integration
Achieved more synergies
Introduced and successfully marketed
tiered pricing

Highlights of the Past Year continued
Initiated preowned certified programs
Achieved first positive Pro Forma Adj.
EBITDA quarter in 4Q08: +$32 m vs.
($224) m in 4Q07
Strong Pro Forma Adj. EBITDA Growth
in 1Q09 to $109 m vs. ($70) m in 1Q08

Near Term Concerns
U.S. auto sales
Churn
Debt

Management Priorities
Grow revenue
Manage churn
Continue cost reductions
Position for auto rebound
Expand new platforms
Manage balance sheet
Cash flow growth
Everything Worth Listening To
Is Now On

We refer to net loss before interest and investment income, interest expense net of amounts capitalized, income tax expense, loss from redemption of debt, loss on investments, other expense (income), restructuring and related cost, depreciation and amortization, and share related payment expense as adjusted EBITDA. Adjusted EBITDA is not a measure of financial performance under U.S. GAAP. We believe adjusted EBITDA is a useful measure of our operating performance. We use adjusted EBITDA for budgetary and planning purposes; to assess the relative profitability and on-going performance of our consolidated operations; to compare our performance from period-to-period; and to compare our performance to that of our competitors. We also believe adjusted EBITDA is useful to investors to compare our operating performance to the performance of other communications, entertainment and media companies. We believe that investors use current and projected adjusted EBITDA to estimate our current or prospective enterprise value and to make investment decisions.
Because we fund and build-out our satellite radio system through the periodic raising and expenditure of large amounts of capital, our results of operations reflect significant charges for interest and depreciation expense. We believe adjusted EBITDA provides useful information about the operating performance of our business apart from the costs associated with our capital structure and physical plant. The exclusion of interest and depreciation and amortization expense is useful given fluctuations in interest rates and significant variation in depreciation and amortization expense that can result from the amount and timing of capital expenditures and potential variations in estimated useful lives, all of which can vary widely across different industries or among companies within the same industry. We believe the exclusion of taxes is appropriate for comparability purposes as the tax positions of companies can vary because of their differing abilities to take advantage of tax benefits and because of the tax policies of the various jurisdictions in which they operate. We believe the exclusion of restructuring and related costs is useful given the non-recurring nature of these transactions. We also believe the exclusion of share-based payment expense is useful given the significant variation in expense that can result from changes in the fair market value of our common stock. To compensate for the exclusion of taxes, other income (expense), depreciation and amortization and share-based payment expense, we separately measure and budget for these items.
There are material limitations associated with the use of adjusted EBITDA in evaluating our company compared with net loss, which reflects overall financial performance, including the effects of taxes, other income (expense), depreciation and amortization, restructuring and related costs, and share-based payment expense. We use adjusted EBITDA to supplement GAAP results to provide a more complete understanding of the factors and trends affecting the business than GAAP results alone. Investors that wish to compare and evaluate our operating results after giving effect for these costs, should refer to net loss as disclosed in our unaudited condensed consolidated statements of operations. Since adjusted EBITDA is a non-GAAP financial measure, our calculation of adjusted EBITDA may be susceptible to varying calculations; may not be comparable to other similarly titled measures of other companies; and should not be considered in isolation, as a substitute for, or superior to measures of financial performance prepared in accordance with GAAP. Please see our most recent filings on Form 10-Q and Form 10-K for additional information.
The following tables reconcile our GAAP income (loss) from operations to our non-GAAP pro forma unadjusted income (loss) from operations.
As Reported
Income (Loss)
from Operations
Predecessor
Financials
Purchase Price
Accounting
Adjustments
Pro Forma
Income (Loss)
from Operations
As Reported
Income (Loss)
from Operations
Predecessor
Financials
Purchase Price
Accounting
Adjustments
Pro Forma
Income (Loss)
from Operations
2005
(829)
(556)
-
(1,385)
2006
(1,068)
(403)
-
(1,471)
2007
(513)
(512)
-
(1,025)
2008
(5,037)
(231)
4,750
(517)
4Q07
(150)
(202)
-
(352)
1Q08
(89)
(93)
-
(182)
2Q08
(68)
(83)
-
(151)
3Q08
(4,827)
(54)
4,743
(138)
4Q08
(53)
-
7
(46)
1Q09
41
-
(6)
35